ADA Price Prediction: Navigating Between $0.70 Support and $6.25 Dream

#ADA
- Technical Weakness: ADA trades below all key moving averages with bearish MACD readings
- Market Dichotomy: Long-term $6+ targets contrast with immediate downside risks
- Critical Level: $0.70 support becoming make-or-break for short-term traders
ADA Price Prediction
ADA Technical Analysis: Bearish Signals Dominate Short-Term Outlook
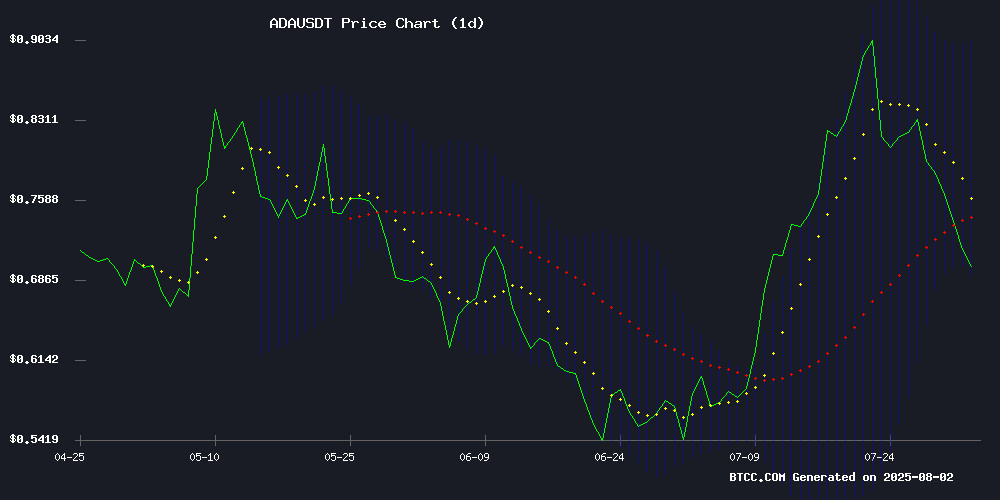
According to BTCC financial analyst Sophia, ADA's current price of $0.7137 sits below its 20-day moving average ($0.7980), indicating bearish momentum. The MACD histogram shows a slight improvement (0.053781) but remains in negative territory, while Bollinger Bands suggest ADA is testing support at $0.6941. 'The technical setup shows ADA struggling to regain bullish momentum,' Sophia notes. 'A sustained break below the lower Bollinger Band could trigger further downside toward $0.65.'
Mixed Sentiment Surrounds ADA as Analysts Debate $6 Potential vs. Immediate Risks
'While some analysts paint a rosy long-term picture for Cardano targeting $6.25,' says BTCC's Sophia, 'the market's long/short ratio deterioration and technical weakness suggest caution.' The conflicting headlines reflect a market torn between ADA's strong fundamentals and current technical vulnerabilities. Sophia adds: 'Traders appear to be pricing in a potential test of $0.70 support before any major upside movement.'
Factors Influencing ADA's Price
Cardano (ADA) Poised for Breakout as Analyst Eyes $6.25 Long-Term Target
Cardano's ADA token shows striking similarities to its 2021 pre-bull run consolidation pattern, with technical analyst Ali Martinez identifying $6.25 as a potential long-term target. The cryptocurrency currently trades near $0.85, testing the critical 0.5 Fibonacci level that historically precedes significant movements.
Martinez's chart analysis reveals ADA mirroring its 2021 behavior: flat base formation, gradual accumulation, and hesitation at resistance levels. The token's current structure suggests a slower but potentially more sustained buildup than during its previous cycle. Key resistance levels loom at $1.15, $1.74, and $3—each representing historical price ceilings that could trigger volatility upon breakthrough attempts.
Market sentiment remains subdued despite the technical setup, creating conditions that often precede explosive price movements. ADA's 2021 rally saw it surge from similar consolidation to all-time highs above $3, suggesting substantial upside potential if historical patterns repeat.
Cardano Could Soar to $6 Soon as ADA Repeats Historic Price Structure: Analyst
Cardano (ADA) may be poised for a significant price surge, with analyst Ali Martinez drawing parallels to its 2020–2021 bull run. Martinez's analysis highlights structural similarities between ADA's current trajectory and its historical performance, suggesting a potential breakout.
Fibonacci extensions indicate ADA could reclaim its previous peak of $3.09, with further upside targets at $4.19 and $6.25. Currently trading around $0.72, ADA's position mirrors its historic breakout phase, albeit at a slower pace.
Cardano’s Long/Short Ratio Slips — Is a Drop Below $0.70 for ADA on the Horizon?
Cardano (ADA) exhibits weakening momentum as its long/short ratio declines, indicating heightened selling pressure. Traders are increasingly positioning for downside, with $7.54 million in long liquidations exacerbating the bearish sentiment. Despite a 12% surge in 24-hour trading volume to $2.54 billion, open interest has contracted by 8%, reflecting dwindling market confidence.
The cryptocurrency’s 30% July rally—fueled by macro-driven buying—now faces reversal risks. Key support at $0.70 hangs in the balance as on-chain metrics deteriorate. Market participants brace for potential cascading liquidations should the downward trajectory persist.
Is ADA a good investment?
Based on current technicals and market sentiment, ADA presents a high-risk/high-reward scenario:
| Metric | Value | Implication |
|---|---|---|
| Current Price | $0.7137 | 17.5% below 20-day MA |
| Key Support | $0.6941 | Bollinger Lower Band |
| MACD | -0.012188 | Bearish but improving |
Sophia advises: 'Dollar-cost averaging may be prudent given the technical oversold conditions and long-term potential. Watch the $0.70 level closely - a weekly close below could signal further downside.'
Technical indicators show bearish dominance
Market sentiment appears divided
High volatility expected near support levels
